Analysis
This layout can be customised. The page below describes it as shipped. To adapt it for a specific purpose, build the arrangement you want as a template in Dashboard > Home — adding, removing, arranging and configuring widgets — then choose Update > Save as Layout and pick this page. Saving replaces this page's layout for every user and the previous arrangement is not kept, so it needs the layout-update permission held by administrators. See Publishing a Template as a Layout.
The Analysis page is the Crypto Inventory Analysis — an in-depth assessment of the cryptographic material discovered across your environment. It combines inventory totals, risk breakdowns, trend charts and policy evaluation into a single layout, so you can see not just what cryptography exists, but how risky it is, how it is trending, and how much of it satisfies your policies. The page is reached from Crypto Inventory > Analysis in the left navigation menu, and the shipped layout is named Analysis-Layout.
An Export PDF button at the top right renders the page to a PDF named after the layout.
Why the Same Widget Appears Several Times
This page places the same widget more than once on purpose, and it is worth understanding before reading the rest: a widget on a dashboard is an instance, and every instance carries its own settings. Two things are set independently:
-
What it counts. The instance's query — for CM Risk Analysis a Cryptomaterial Type (Key, Certificate, Protocol or Source Code) and a Criteria; for the Policy Analysis family a Policy Name and a Key Type (All, Secret Key, Private Key or Public Key).
-
How it is drawn. Chart Type is bar, pie or doughnut. A bar then chooses Vertical or Horizontal; a pie or doughnut chooses one of five legend styles — Simple Legend Number, Simple Legend Percent, Table Legend Number, Table Legend Percent or Bar Legend.
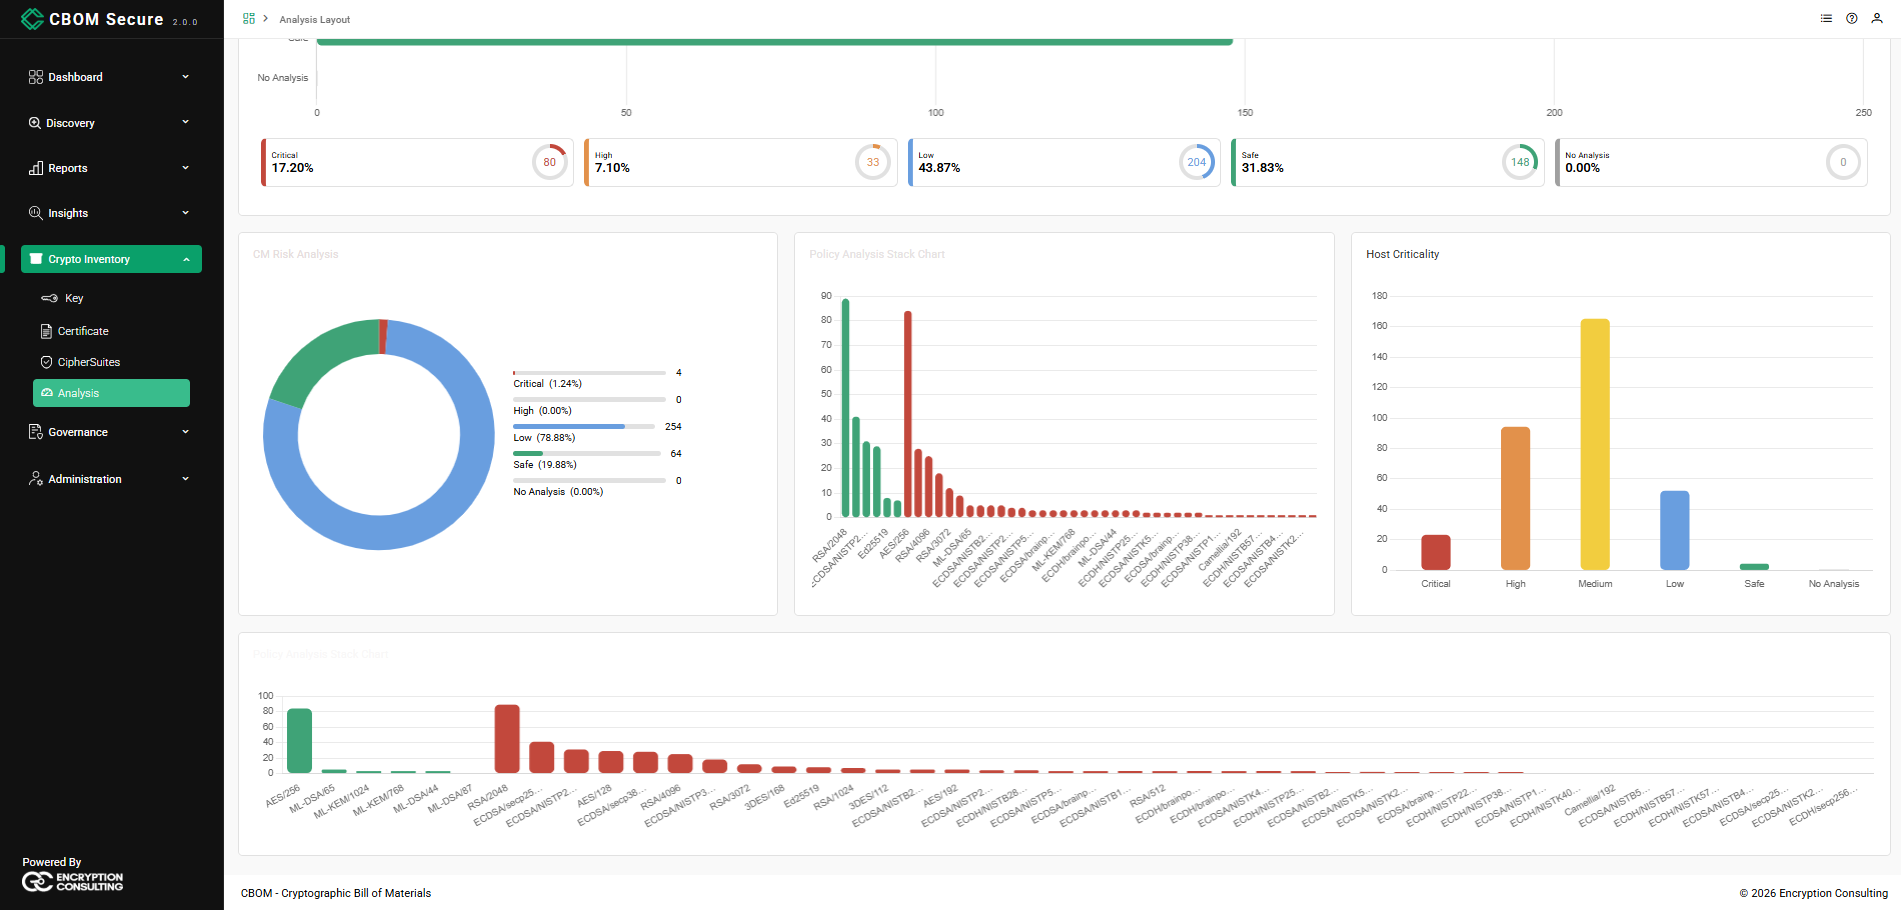
So two cards with the same title are not duplicates: they are the same widget asking different questions, or asking the same question and answering it in a different shape. Two Policy Analysis doughnuts showing Pass 99 / Fail 366 and Pass 44.09% / Fail 55.91% are the Table Legend Number and Table Legend Percent styles of the same evaluation. Where the counts themselves differ, the queries differ. Open a card's configuration to see which policy, type and criteria it is bound to.
KPI Single Value Grids
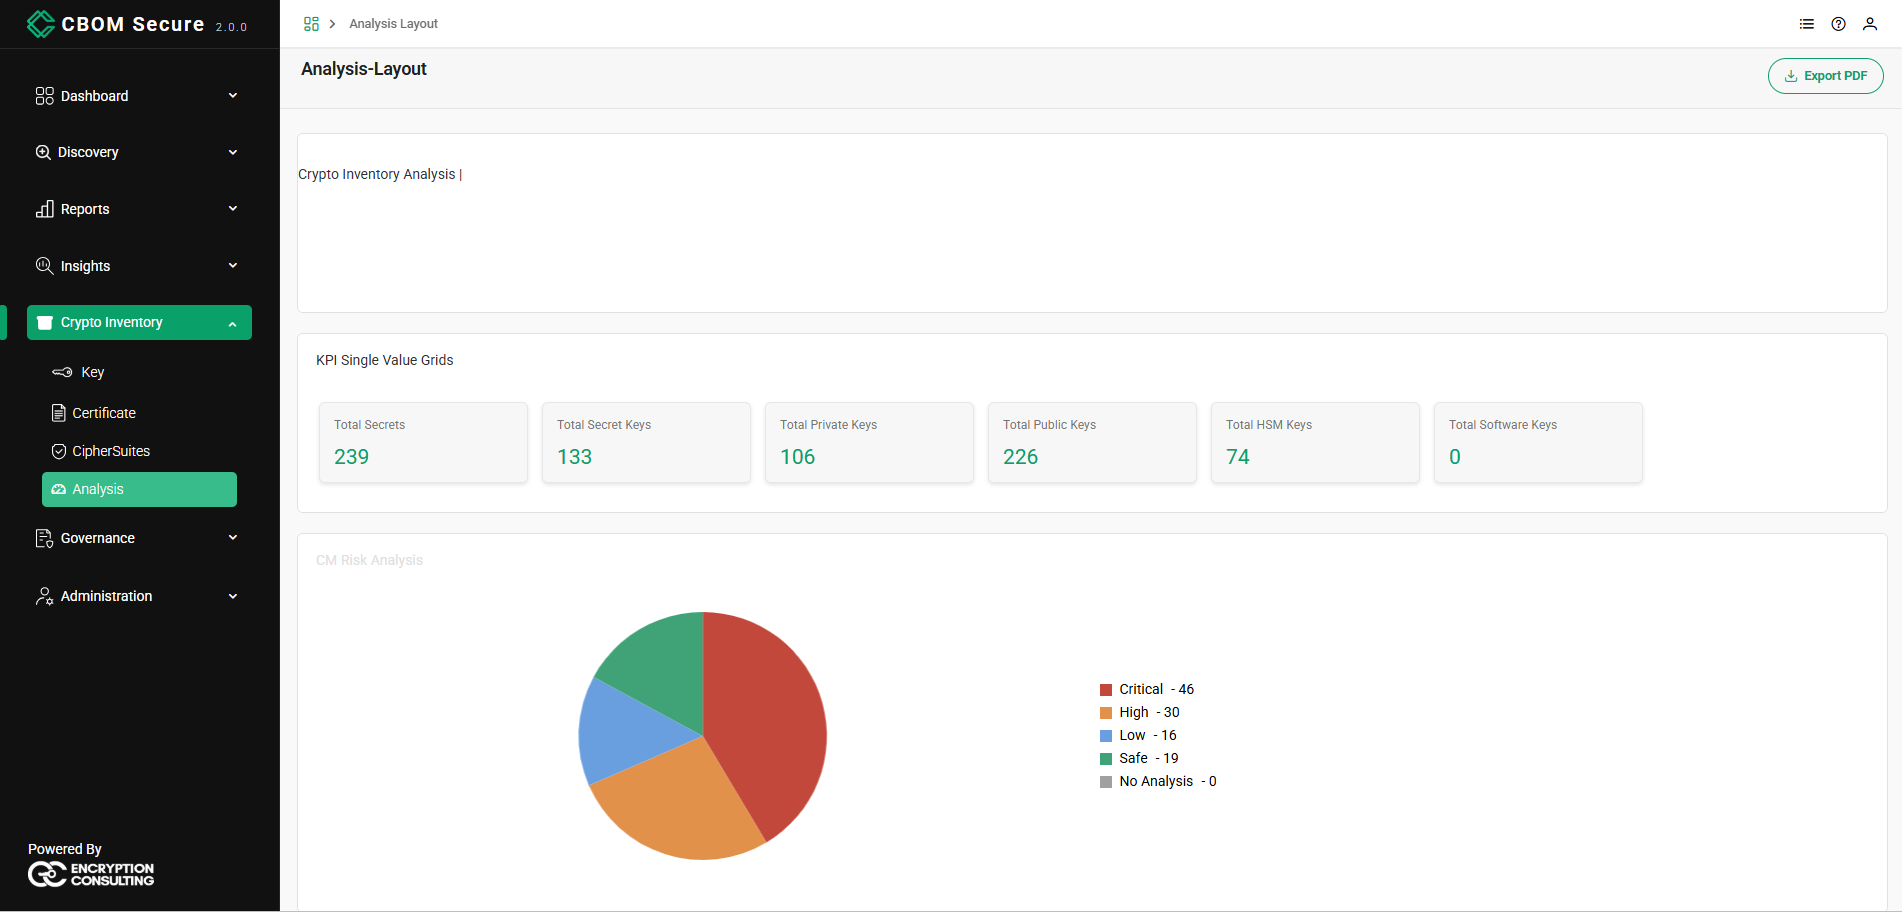
The page opens with a text widget introducing it (Crypto Inventory Analysis) and then a row of single-value cards summarising the inventory. Each card is one KPI chosen from the platform's catalogue, so the set on your dashboard is configurable; the shipped selection is:
Total Secrets: Secret and private keys combined.
Total Secret Keys: Symmetric secret keys only.
Total Private Keys: Private keys only.
Total Public Keys: Public keys only.
-
Total HSM Keys: Secret and private keys held in a hardware security module.
-
Total Software Keys: Secret and private keys with no hardware protection recorded.
CM Risk Analysis
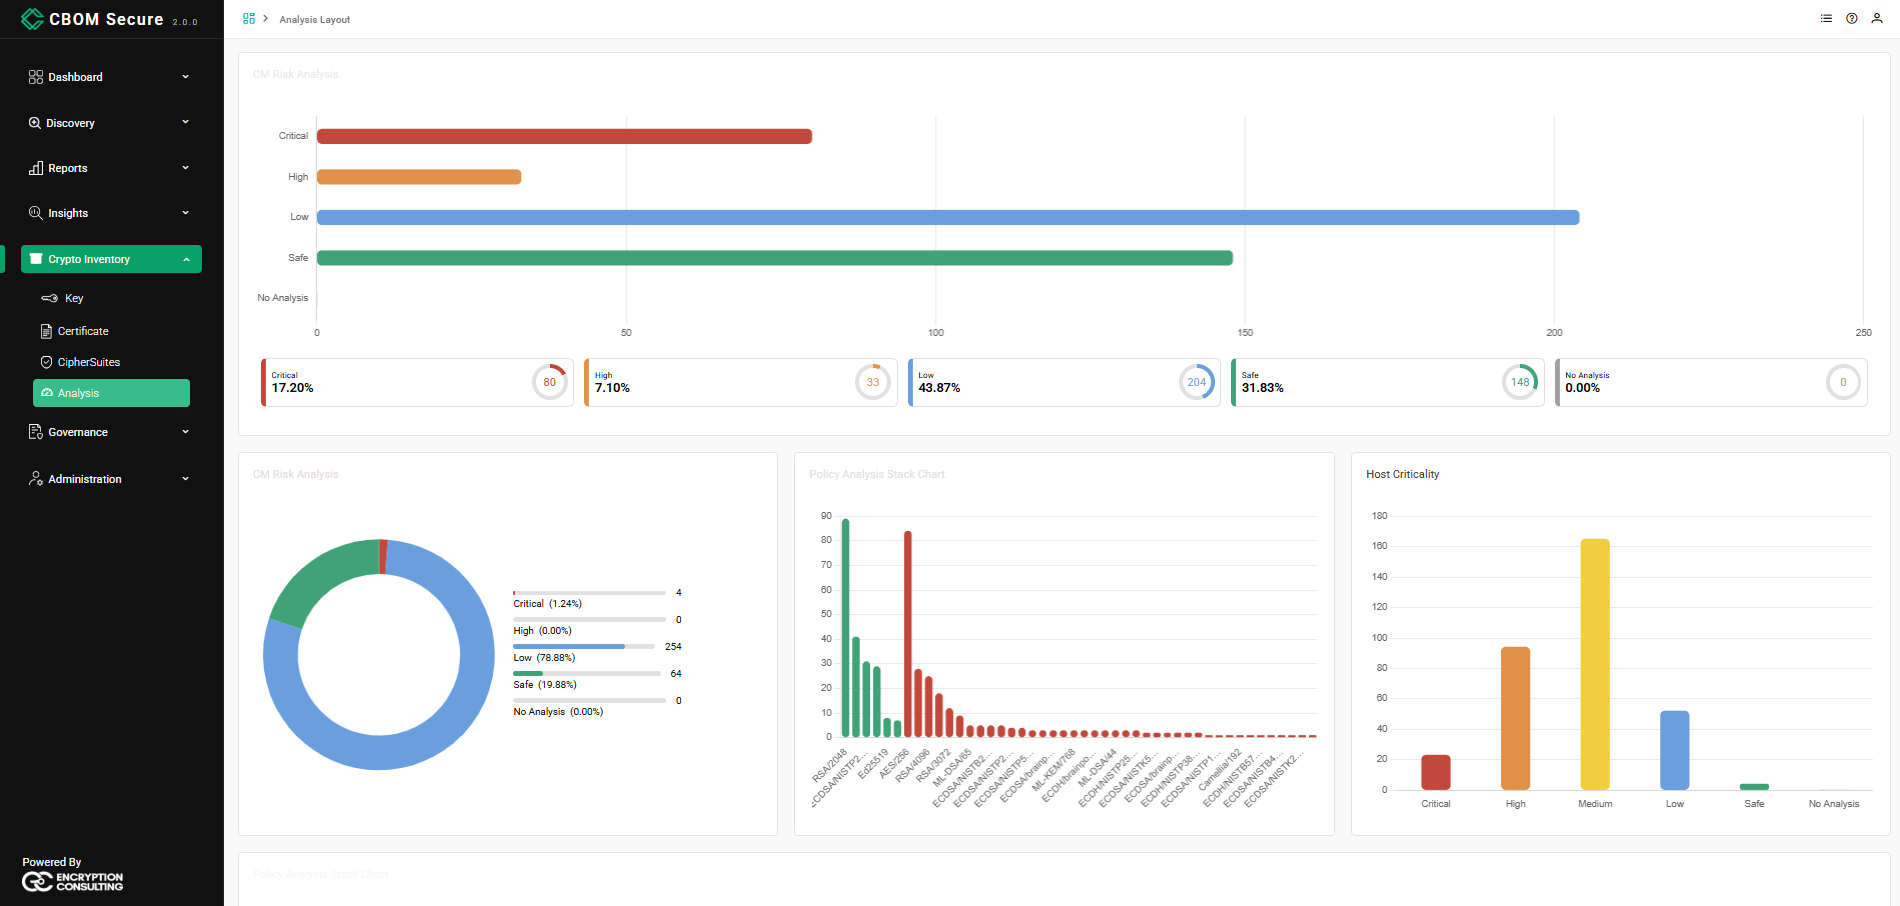
CM Risk Analysis grades the cryptographic material by risk severity — Critical, High, Low, Safe and No Analysis. The page carries three instances, each bound to a different material type and criteria and each drawn in a different shape, so the same grading can be read at three levels of detail:
-
Pie: The proportion in each severity with the counts beside it, for example Critical — 46.
-
Horizontal bar with indicator cards: The volume in each severity on a linear count axis, with a row of cards underneath giving each severity's share and total — Critical 17.20% (80), High 7.10% (33), Low 43.87% (204), Safe 31.83% (148), No Analysis 0.00% (0). Clicking a bar drills into the material behind it.
-
Doughnut with a bar legend: Each severity as a miniature progress bar with its percentage and count, so a long tail of small values stays readable.
Because the three instances are configured differently, their totals are meant to differ. A criteria such as Key Reuse also scores a key against the rest of the population, so a key can move from Safe to Critical because an unrelated key elsewhere shares its public key.
Cryptomaterial Risk Time Series
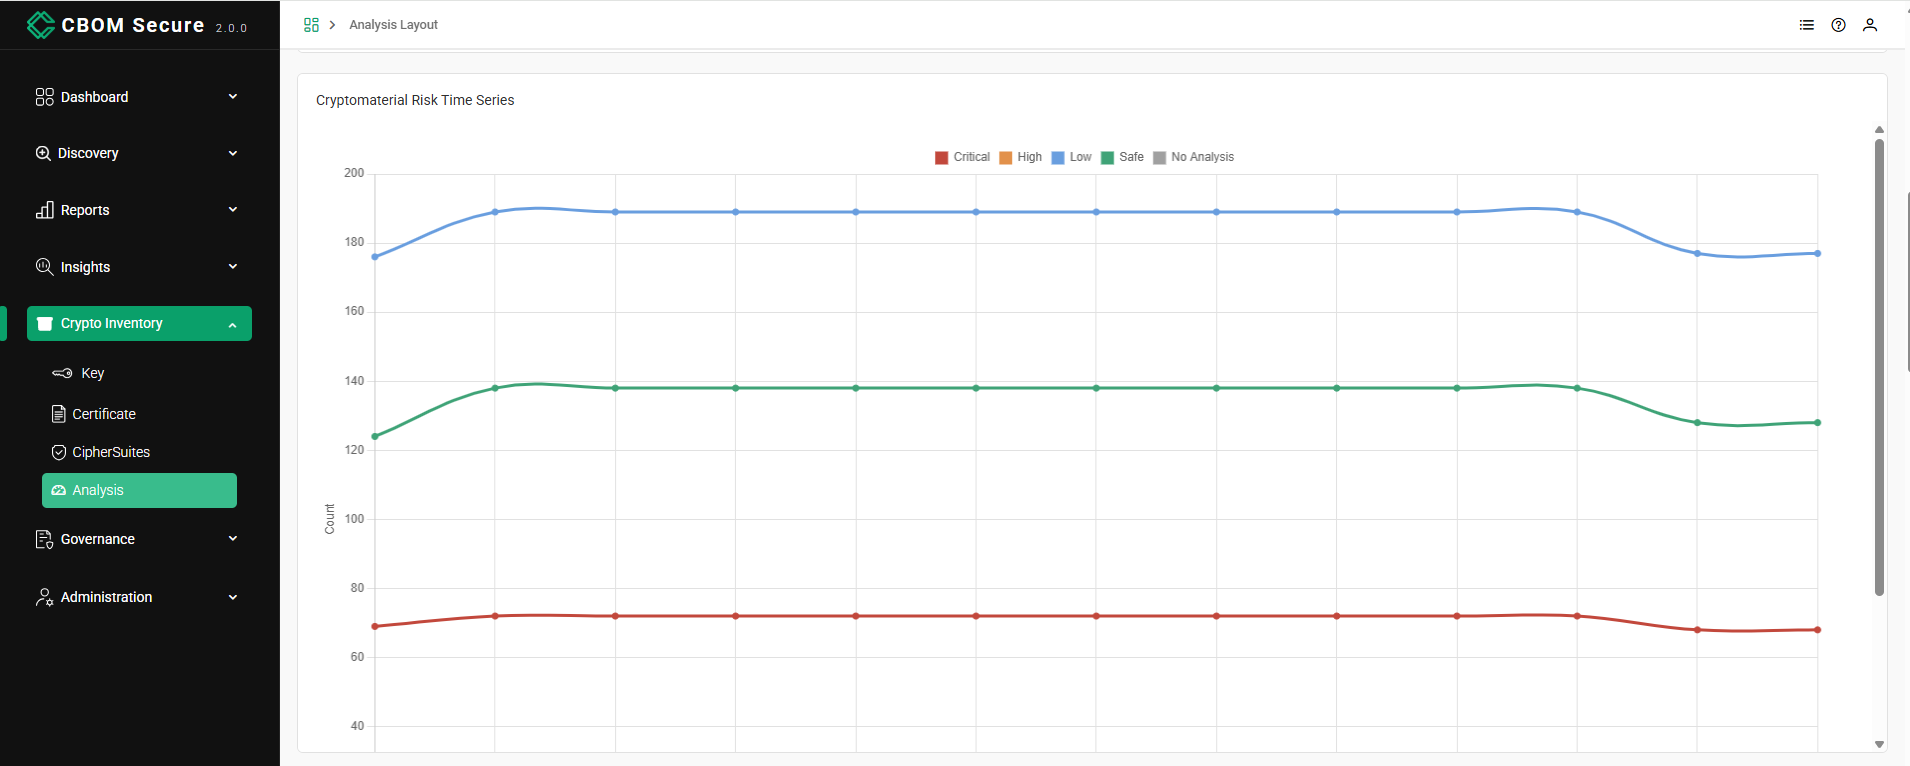
The Cryptomaterial Risk Time Series chart plots how each risk severity has moved over time, so you can see whether the overall posture is improving or deteriorating.
Each point is a point-in-time reading rebuilt from the material's own change history rather than a stored snapshot, so a material keeps its last known grade across quiet periods and drops out of the series when it is resolved. Set a From Date, an Interval and an optional To Date in the widget's configuration and the whole series is recomputed for that window.
Policy Analysis
Policy Analysis evaluates the inventory against one selected policy and reports it as Pass versus Fail. Pick the policy and the key type in the widget's configuration — the Policy Name dropdown lists the policies defined under Policy Management, and Key Type narrows the evaluation to secret, private or public keys.
The shipped layout places three instances so the same result can be read three ways: a doughnut with a Status / Total table, a doughnut with a Status / % table, and a pie with the counts in the legend.
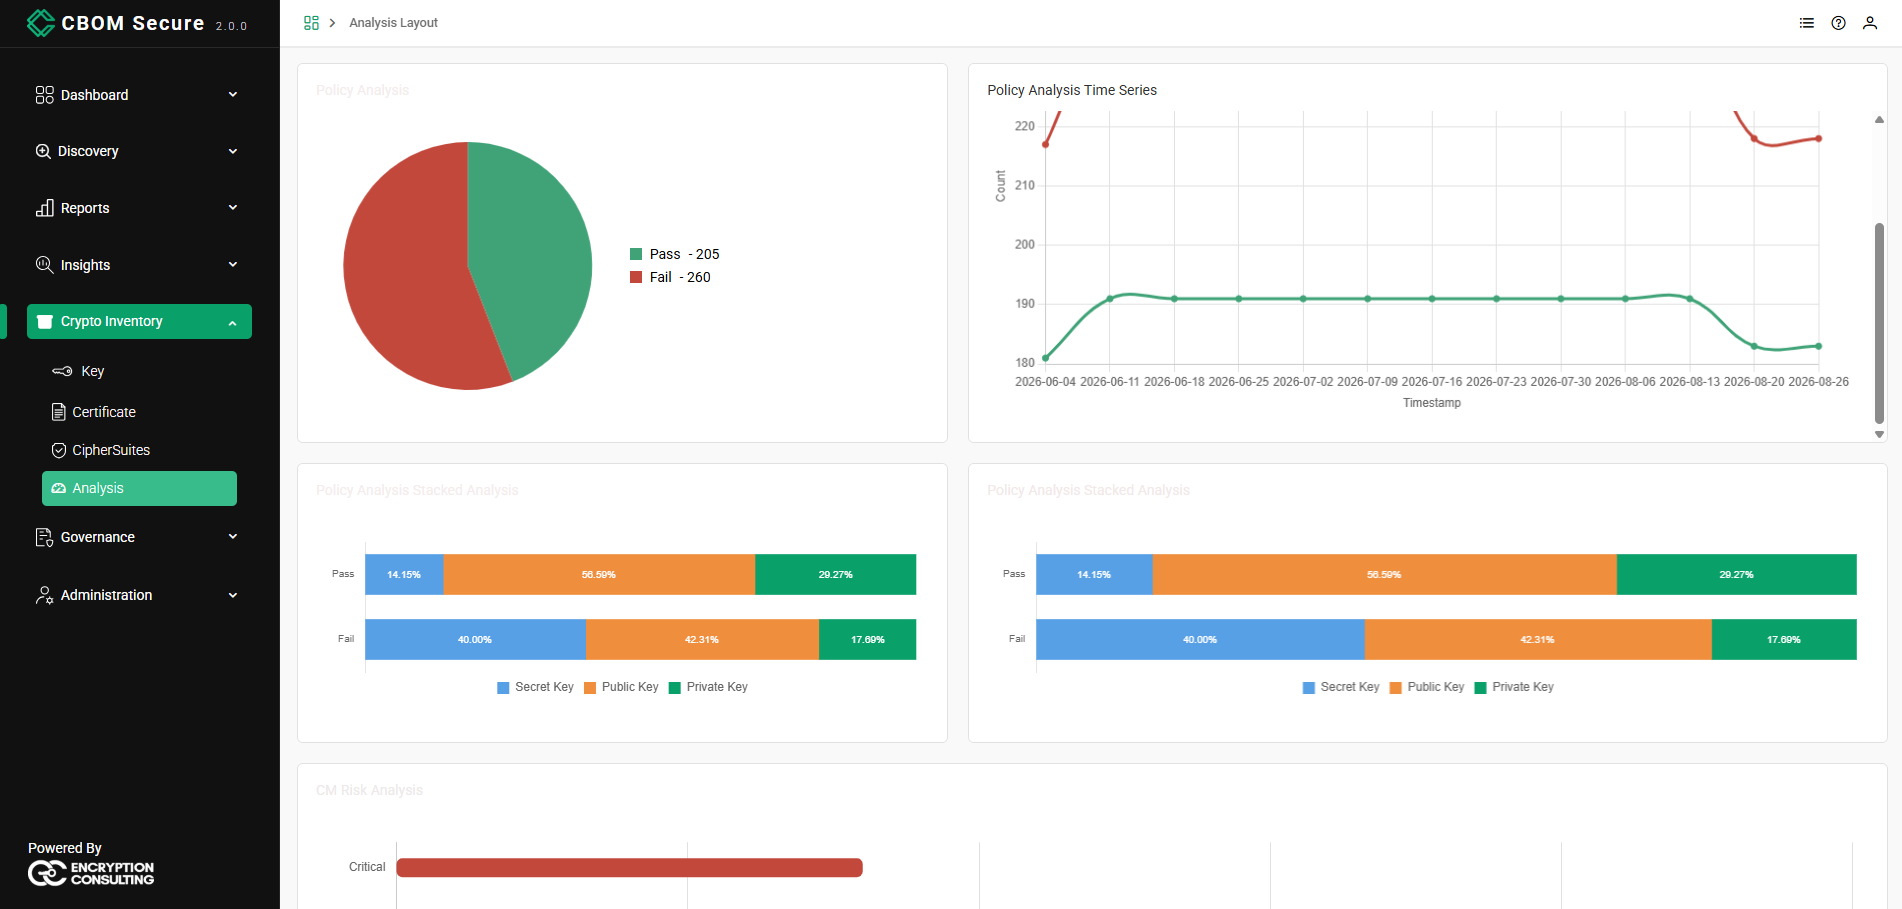
Policy Analysis Time Series
The Policy Analysis Time Series chart tracks the same Pass/Fail evaluation over time, so a crossover where passing material overtakes failing material shows the posture improving.
Like the risk series, each point is recomputed from the material's change history, so you choose the window: set a From Date, an Interval and an optional To Date and the chart is rebuilt for that range — including ranges that end before the policy itself was created. Use Exclude Resolved Materials to drop decommissioned items from the counts.
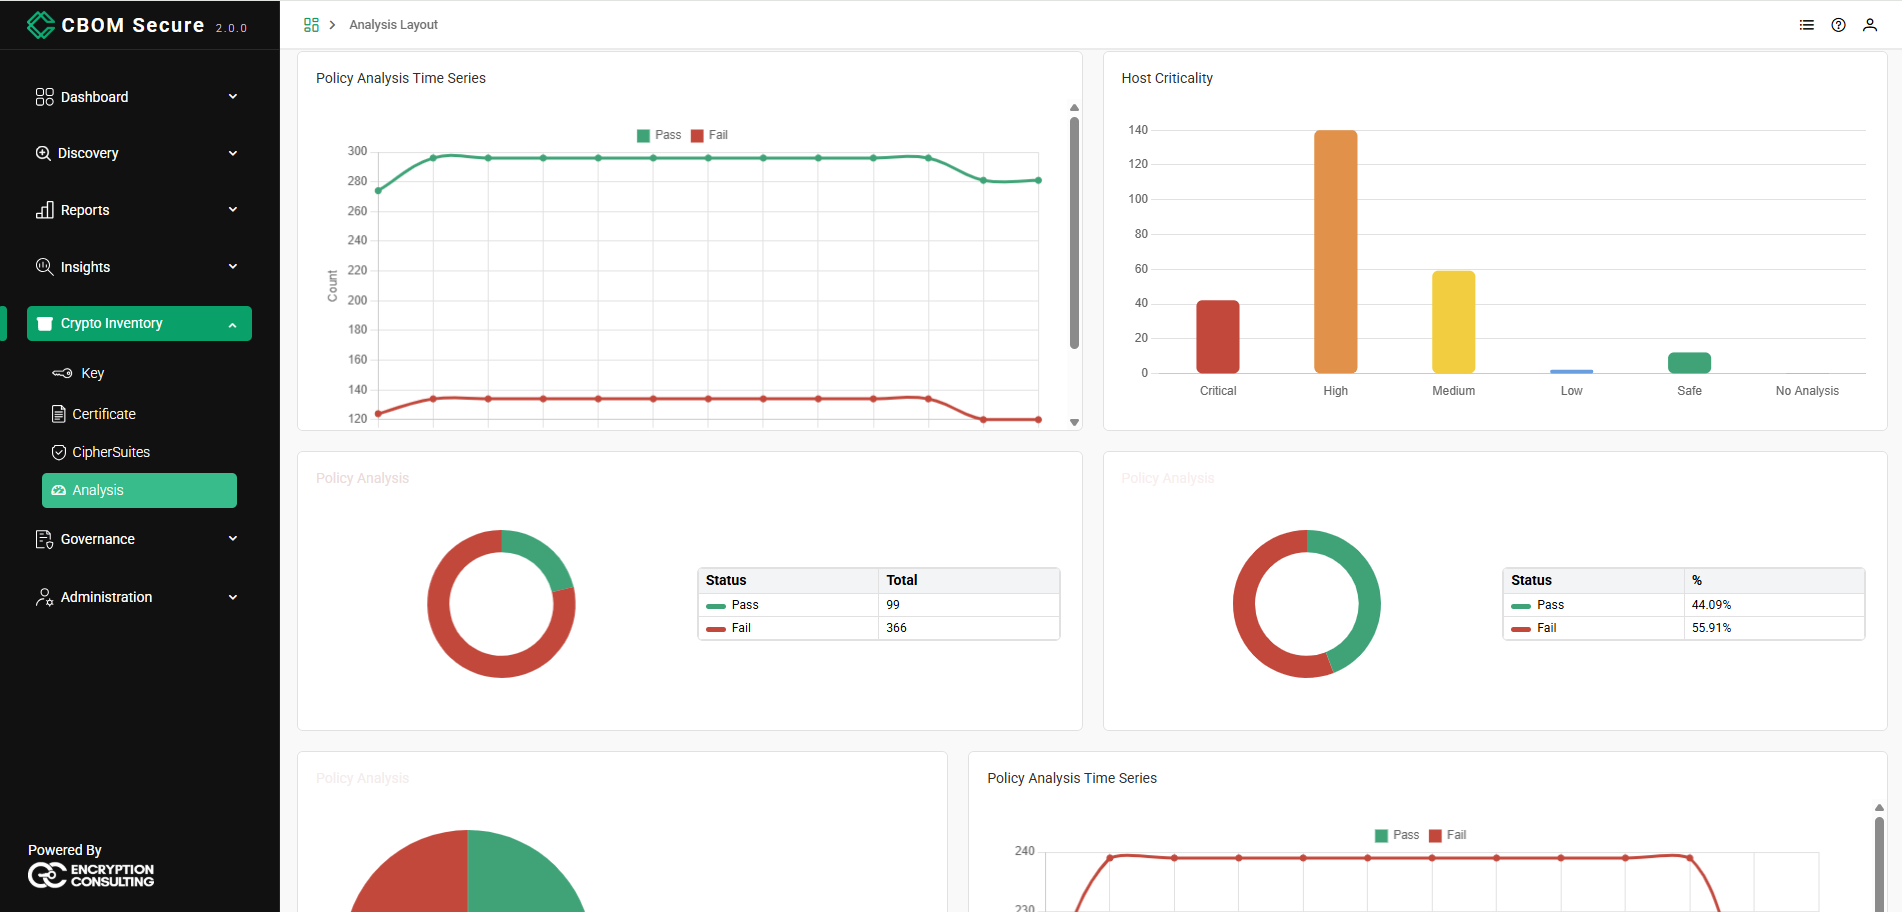
Host Criticality
The Host Criticality chart groups hosts by their criticality level — Critical, High, Medium, Low, Safe and No Analysis — so remediation can start with the hosts that matter most. Its configuration takes a material type (All, Key, Certificate or Protocol) and an optional single host, so an instance can either survey the estate or focus on one machine.
Policy Analysis Stacked Analysis
Policy Analysis Stacked Analysis takes the Pass and Fail populations of one policy and splits each into two horizontal bars broken down by key type — Secret Key, Public Key and Private Key — with each segment's share labelled. It answers which kind of key is driving the failures: a Fail bar that is 40% secret keys and 42% public keys points remediation somewhere quite different from one dominated by private keys.
Policy Analysis Stack Chart
The Policy Analysis Stack Chart shows the inventory one algorithm at a time as evaluated against the policy. Each bar is a specific algorithm and key size — for example RSA/2048, AES/256, Ed25519, ML-DSA/44, ECDSA/NISTP256 or Camellia/192 — coloured by whether that algorithm passes, and hovering a bar reveals the algorithm name and its exact count. Where the two charts above tell you how much fails, this one names the entries responsible.